


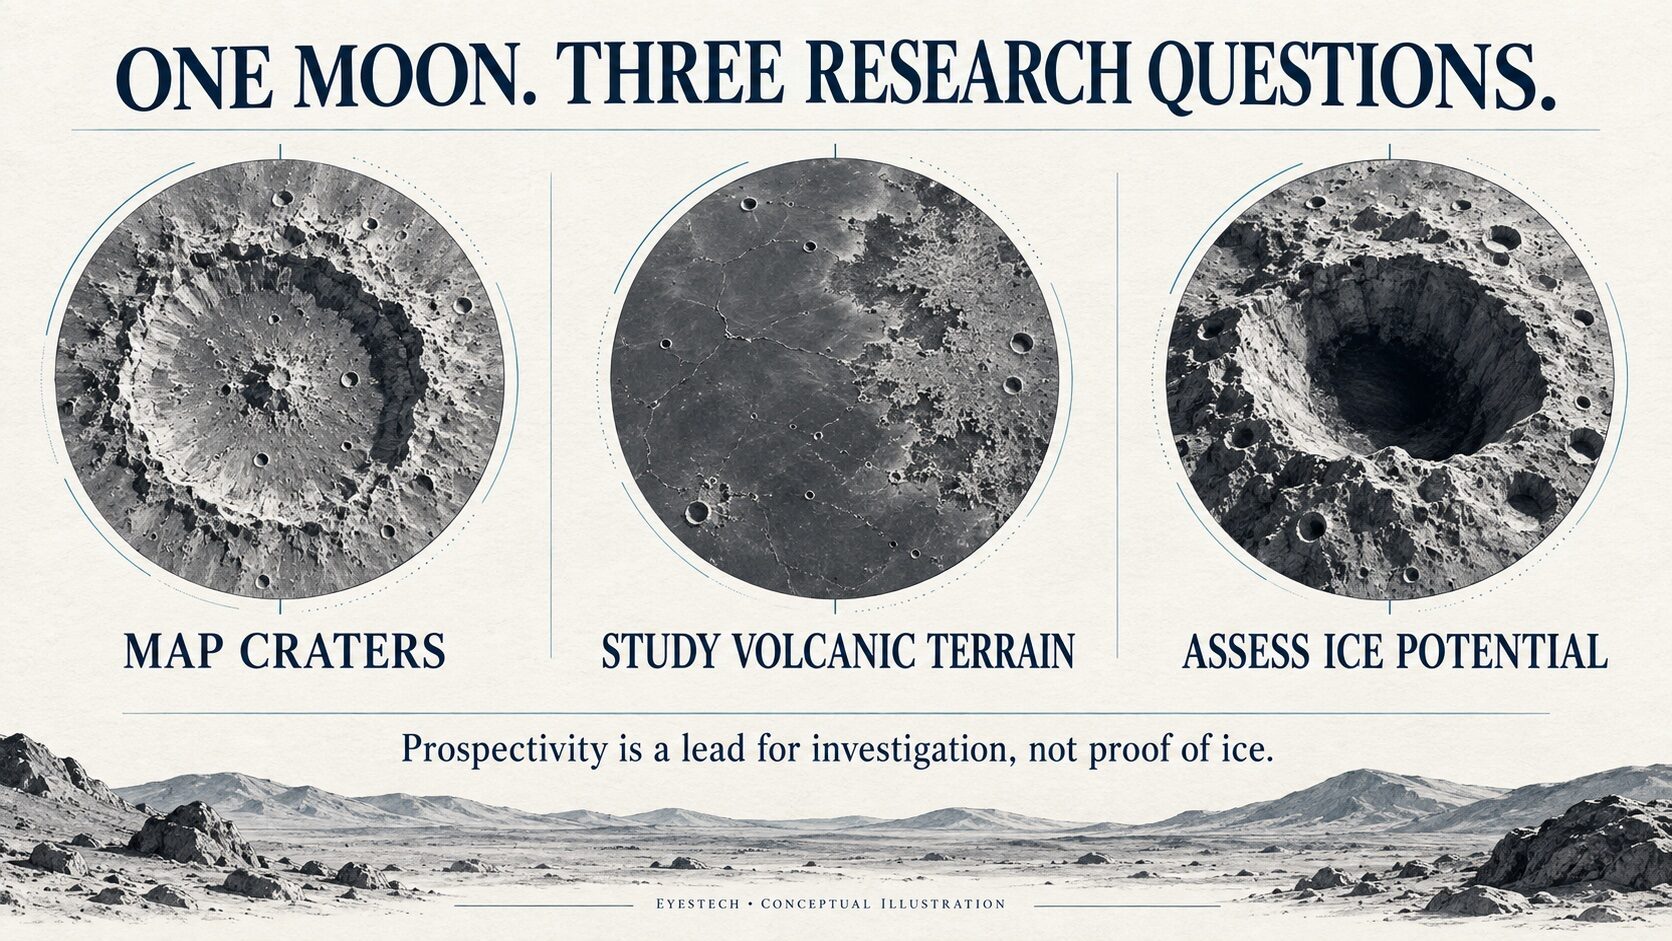
NASA and IBM’s Lunar Foundation Model could help researchers narrow the search for ice on the Moon. Its strongest reported improvement concerns ice prospectivity: identifying promising locations for investigation. That result measures agreement with an existing scientific map, rather than newly confirmed deposits. The open-source model also supports crater mapping and volcanic-feature analysis. The model documentation makes that distinction explicit.
Announced on September 10, 2026, the release gives lunar scientists a reusable starting point for analyzing observations from multiple missions. The useful question now is what researchers can do with it, how well it performs, and where to get the weights and data. IBM’s release announcement describes the initial scientific priorities.
What is the NASA–IBM Lunar Foundation Model?
The model learns relationships between different kinds of lunar observations, then adapts to specific scientific tasks. Its training corpus contains nearly two million aligned tile bundles spanning 11 modalities, with imagery anchored at roughly one meter and 100 meters per pixel. Inputs draw on Lunar Reconnaissance Orbiter instruments and missions including Kaguya, GRAIL and Lunar Prospector. The technical report describes the data and training design.
Alignment matters because instruments observe different properties at different scales. An optical image records surface appearance; elevation describes terrain; other measurements provide thermal, radar or compositional context. A useful prediction depends on understanding which measurements describe the same place.
The system adapts TerraMind’s masked-token approach, learning to predict withheld information from available inputs. It also receives illumination and acquisition geometry explicitly. That helps account for a basic lunar imaging problem: the same terrain can look very different as lighting changes. Researchers can adapt the pretrained model for detection, segmentation and regression. Method and architecture.
Why combining lunar observations is difficult
Consider a researcher examining a crater rim. A dark area in an optical image needs interpretation alongside the terrain and observation conditions. A slope facing away from the Sun can cast a shadow; a change in brightness is not automatically a change in material. The value of combining observations is that one measurement can help constrain the interpretation of another.
Spatial scale creates a separate problem. A broad regional measurement cannot supply the same detail as a close view of a small surface feature. Aligning both to a common patch gives the model shared geographic context, but it does not turn every coarse measurement into a new high-resolution observation. That distinction matters whenever a generated map appears more detailed than its inputs.
SomBench organizes observations into two tracks. Its lower-resolution tiles cover about 51.2 kilometers on each side, while the higher-resolution tiles cover about 512 meters on each side. The dataset preserves the optical observation context, including overlapping views of terrain under different illumination. This gives researchers a way to investigate how appearance changes without assuming that the surface itself has changed. SomBench construction and tile coverage.
Can it actually find ice on the Moon?
It can predict ice prospectivity. That means estimating how promising a location looks under the benchmark’s existing scientific assumptions. The evaluation target is a knowledge-based prospectivity map, not direct measurements of newly discovered ice.
This makes the output useful for prioritizing investigation, but it does not establish how much water exists at a location or whether a mission could extract it. The model card also excludes operational uses such as landing-site certification and hazard clearance. Intended uses and limitations.
What the crater and volcanic benchmarks show
The results vary by task. The coarse crater benchmark shows useful label efficiency: the lunar model trained with half the data exceeds the strongest listed baseline trained on the full dataset. Meter-scale crater detection and volcanic-feature segmentation are much closer contests.
| Task | Metric | Best lunar model | Best baseline |
|---|---|---|---|
| Coarse crater detection, 50% training data | mAP ↑ | 0.2541 ± 0.0018 | 0.2313 ± 0.0027 |
| Coarse crater detection, 100% training data | mAP ↑ | 0.2581 ± 0.0017 | 0.2420 ± 0.0047 |
| Meter-scale crater detection | mAP ↑ | 0.1543 ± 0.0098 | 0.1552 ± 0.0086 |
| Irregular mare patch segmentation | IoU ↑ | 0.5709 ± 0.0114 | 0.5687 ± 0.0181 |
| Polar ice prospectivity | RMSE ↓ | 0.0293 ± 0.0013 | 0.0377 ± 0.0004 |
Higher mAP and intersection-over-union scores are better; lower root mean square error is better. These metrics measure different tasks and cannot be compared across rows. Each row reports the best adaptation strategy, rather than one configuration winning every test. The model card treats the meter-scale crater and volcanic leaders as comparable because their differences are smaller than run-to-run variability. Benchmark table and evaluation notes.
For lunar history, irregular mare patches are particularly interesting because their ages remain debated. Mapping their boundaries and distribution could support that investigation. Segmentation alone cannot establish when a feature formed. IBM’s explanation of the volcanic research application.
How to read the reported improvement
The ice-prospectivity error falls from 0.0377 to 0.0293. Subtracting those values and dividing by the baseline gives a relative reduction of approximately 22%. That is a reduction in a regression error metric. It should not be restated as 22% more ice found, or a 22-percentage-point increase in discovery accuracy. Neither claim follows from the measurement.
The crater result answers a different question: can a pretrained model make better use of a limited labeled dataset? The half-data result is encouraging because a smaller training set still produces a competitive detector. For a research group deciding where to spend annotation effort, that can be more useful than a small improvement obtained only after labeling everything.
Our reading of these results is that the release deserves task-by-task evaluation. The benchmark table does not justify declaring one universal winner across lunar science. A team studying small craters should evaluate detection errors on that imagery; a team mapping volcanic patches should inspect boundary quality. Their scientific costs of a missed feature or a false detection may be different.
Where to download the weights and lunar datasets
The Hugging Face model repository lists an Apache 2.0 license and contains pretrained weights and tokenizer assets. The companion NASA–IBM GitHub repository is linked from the model card for fine-tuning code and configurations using TerraTorch.
The SomBench pretraining dataset page needs a closer reading: it describes the Hugging Face contents as a small sample. It directs users to the public AWS bucket s3://nasa-lunar-fm-bench/ for the full corpus. Its listed sizes are approximately 38 TB for the lower-resolution track and 1.4 TB for the higher-resolution track, under a CC BY 4.0 dataset license.
Those sizes make the distinction practical. Downloading a checkpoint or inspecting sample tiles is a different commitment from reproducing data-intensive training. Researchers should first identify their scientific task, available inputs and evaluation labels, then choose the relevant release components.
A practical starting point for researchers
Begin with a question narrow enough to evaluate. For crater work, define the sizes and terrain your detector must handle. For volcanic mapping, decide what counts as a correct boundary. For ice prospecting, document exactly what the target map represents. A model can fit the supplied labels well while leaving the broader scientific question unresolved.
Next, inspect a small sample of the data before planning a full download. Check that the available layers cover the same locations, that their units and missing values are understood, and that the intended task has suitable reference labels. Keep those checks attached to the experiment so another researcher can understand which observations supported each result.
Finally, compare the adapted model with a reasonable baseline using the same evaluation data. Review individual failures as well as the aggregate score. Record the checkpoint, inputs and adaptation settings used. These are recommended evaluation steps, not a claim that EyesTech has run the model or independently reproduced the team’s benchmarks.
What makes this release worth using
The strongest case is reuse. Teams get a common model and evaluation framework for testing how multiple lunar observations improve a specific task. The reported results justify investigating that starting point, particularly where labeling data is expensive.
A promising ice map still needs scientific verification. A mapped volcanic patch still needs geological interpretation. Open weights and documented benchmarks make those questions easier for other researchers to examine—and that is where this release can earn its value.